FastD Manual
Insecticide resistance causing failures in controlling insect pests incurs huge damages both in human health and agricultural production. To control insecticide resistance, monitoring insecticide resistance is extremely important. It is reported and confirmed that insecticide resistance mainly emerges from two mechanisms, prevalence of insecticide target-site mutations and overexpression of detoxification enzymes (mainly encoding by P450, GST and CCE genes).
Here, we constructed a webserver, FastD, to simultaneously detect insensitive target-site mutations and overexpressed detoxification genes associated with insecticide resistance. FastD includes two tools, FastD_TR to detect resistance-associated target-site mutations, and FastD_MR to detect resistance associated overexpressed detoxification genes.
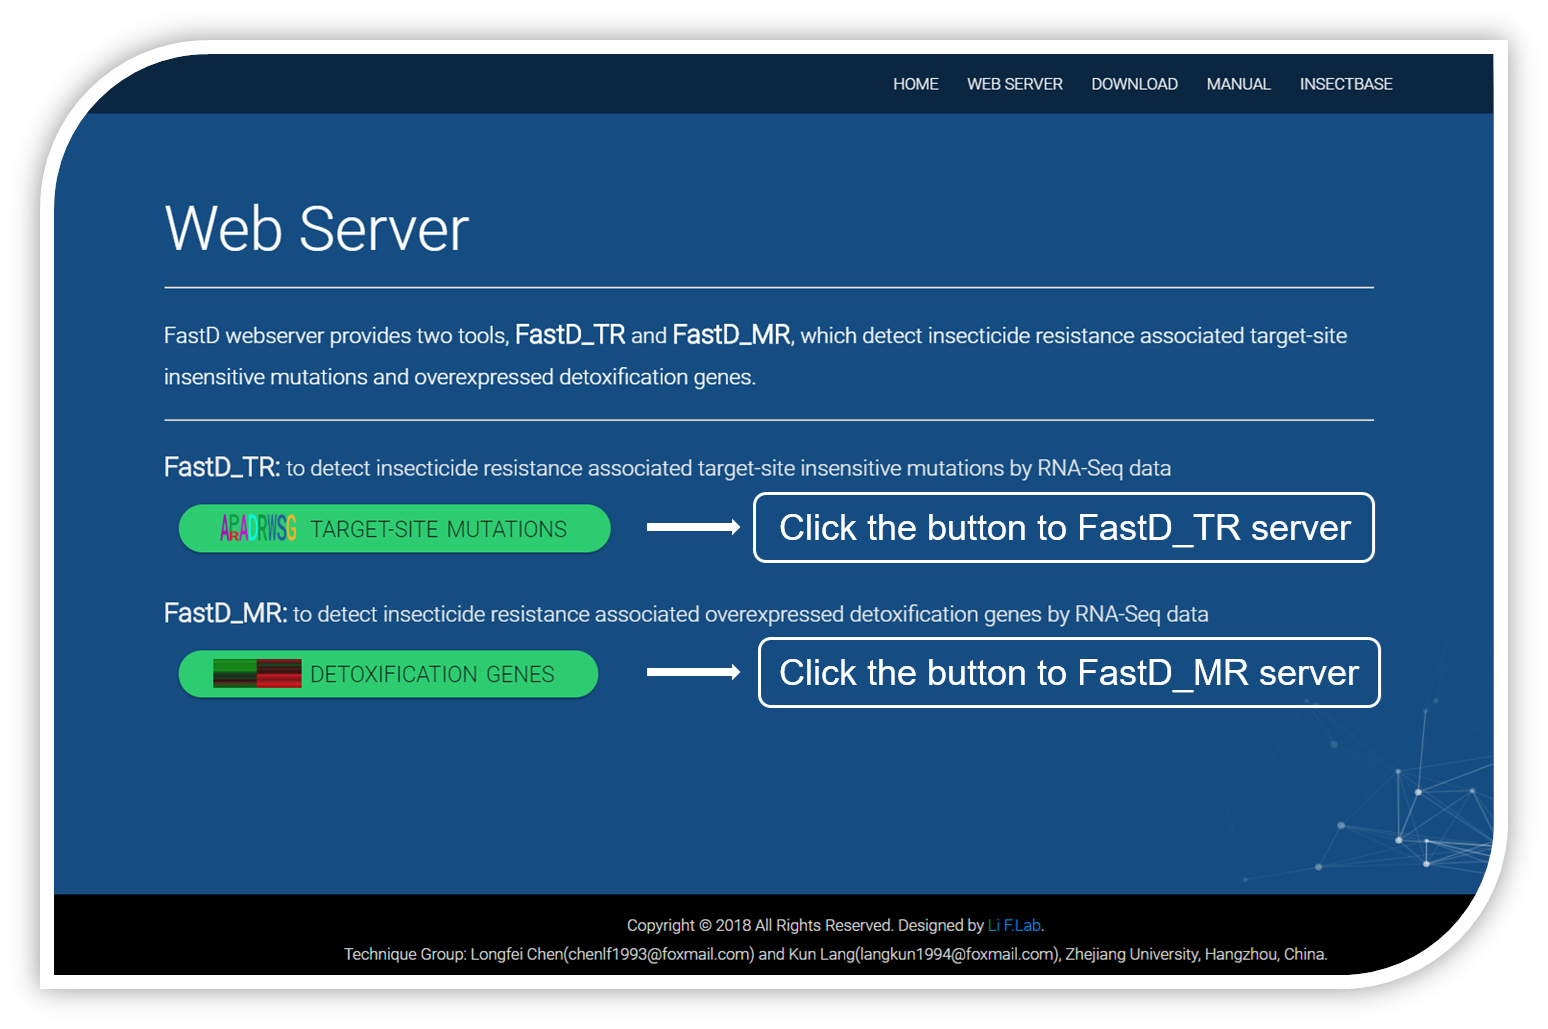
FastD_TR webserver
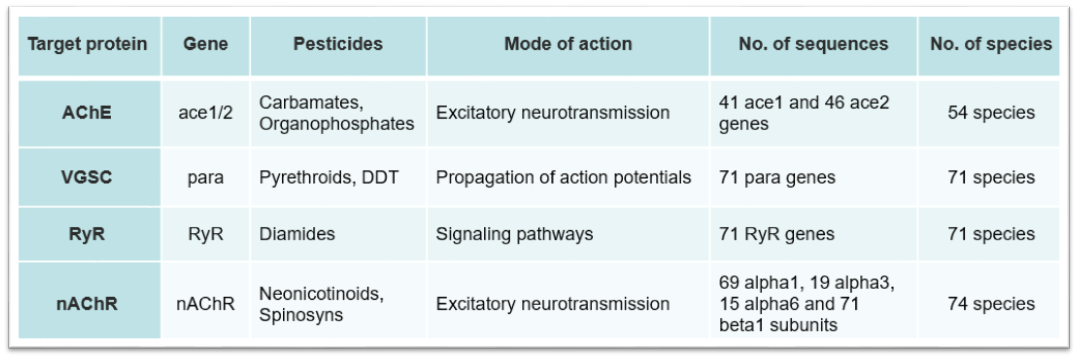
FastD_TR was developed to detect insecticide resistance by scanning resistance-associated target-site mutations and calculating their allele frequencies in test population. Resistance to different insecticides were caused by mutations in their targets. Therefore, when you use FastD_TR to detect the resistance to specific insecticide, you must choose the corresponding target. The relationships between insecticides and their targets were listed below:
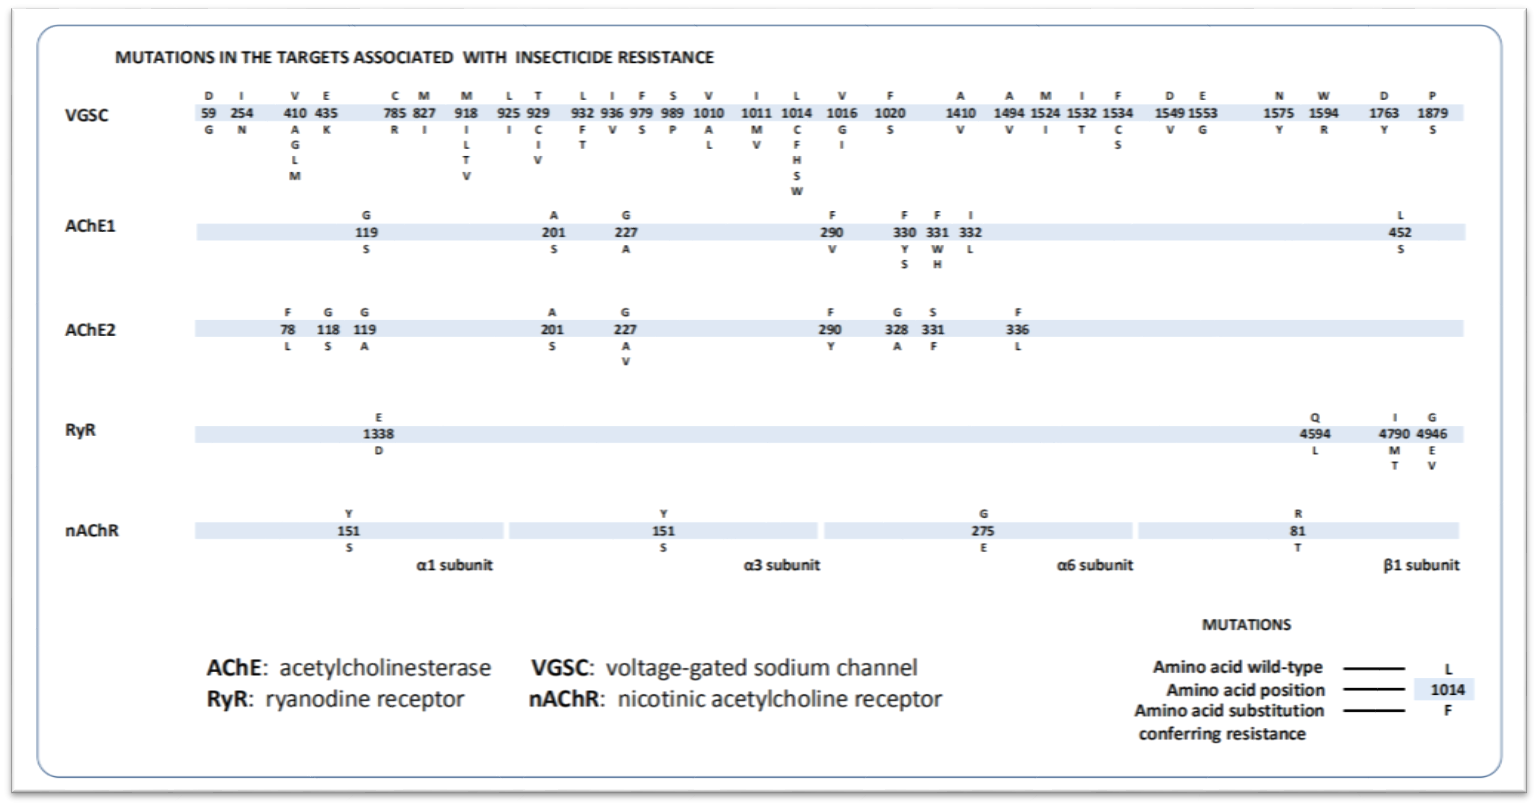
Since the first report of insecticide resistance-associated target-site mutation, researchers have reported hundreds of target-site insensitive mutations associated with resistance to dozens classes of insecticides. In the FastD_TR program, we have collected 76 known target mutations of four targets from 82 species. All mutations in homologous target genes from different species were marked in one standard target sequence to create the mutation profile. According to the similarity between homologous genes, the corresponding sites of all mutations in target sequence of each species were treated as potential mutation sites.
Mutation profiles of ten insecticide targets
Due to the huge quantity of insects, the investigations on insects are always in population level. Allele frequency of specific allele is a very important parameter of a population, so the pooling sequencing is a very important strategy to investigate the features of populations. Therefore, the allele frequency of the reported mutations can be reliable indicator of resistance level.
To detect insecticide resistance-associated mutations and calculate their frequencies, a list of steps should be implemented.
Preparation of input
You can start an analysis by providing alignment file. To prepare the alignment file of test species and test pesticides, you should first make it clear that which species and which insecticides you want to detect, then download the target sequences of tested species according to the relationship file. If you want to detect mutations in multiple targets, you can download all the targets genes and assemble them into one .fasta file. Finally, align RNA-Seq data of test sample to the assembled target sequences by bowtie2 with --no-unal parameter, the result sam file would be the input of the FastD_TR.
Upload the input
To detect insecticide resistance-associated mutations,you should follow three steps.
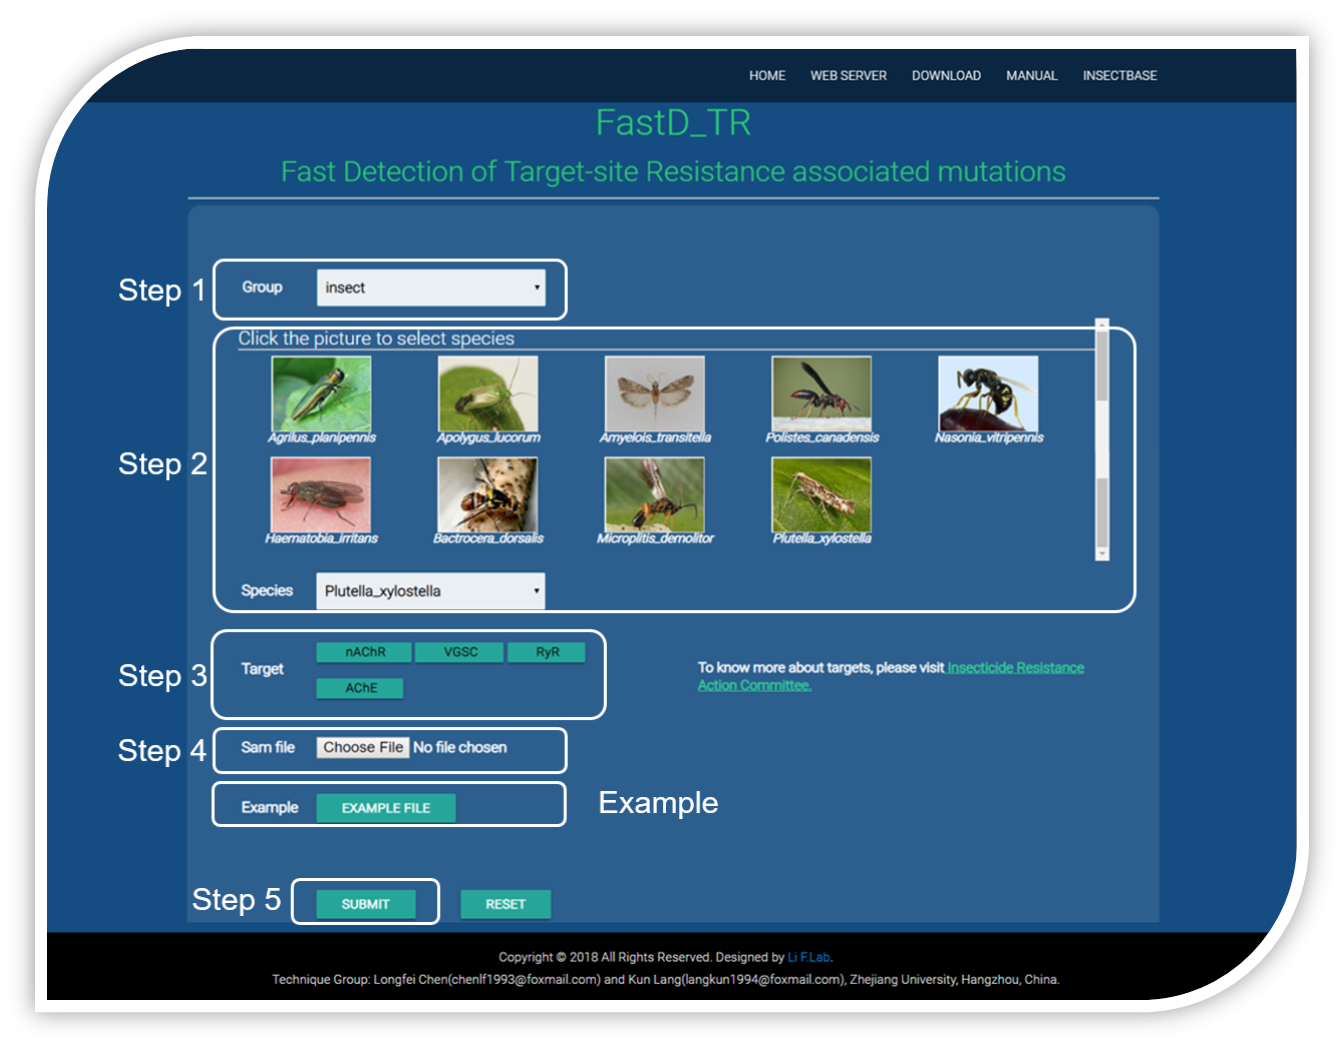
Step 1 : you should first select the group of your test organism, Insect.
Step 2 : select your test species from by clicking the picture or selecting from the list directly.
Step 3 : after the species be selected, the targets of this species would displayed, then tick your test targets.
Step 4 : upload the alignment file prepared before as input data.
Step 5 : click the SUBMIT button and wait a few minutes.
Example includes three alignment files.
Click the EXAMPLE FILE button to download the alignment file of nAChR, VGSC, RyR and AChE of Plutella xylostella.
FastD_TR Result
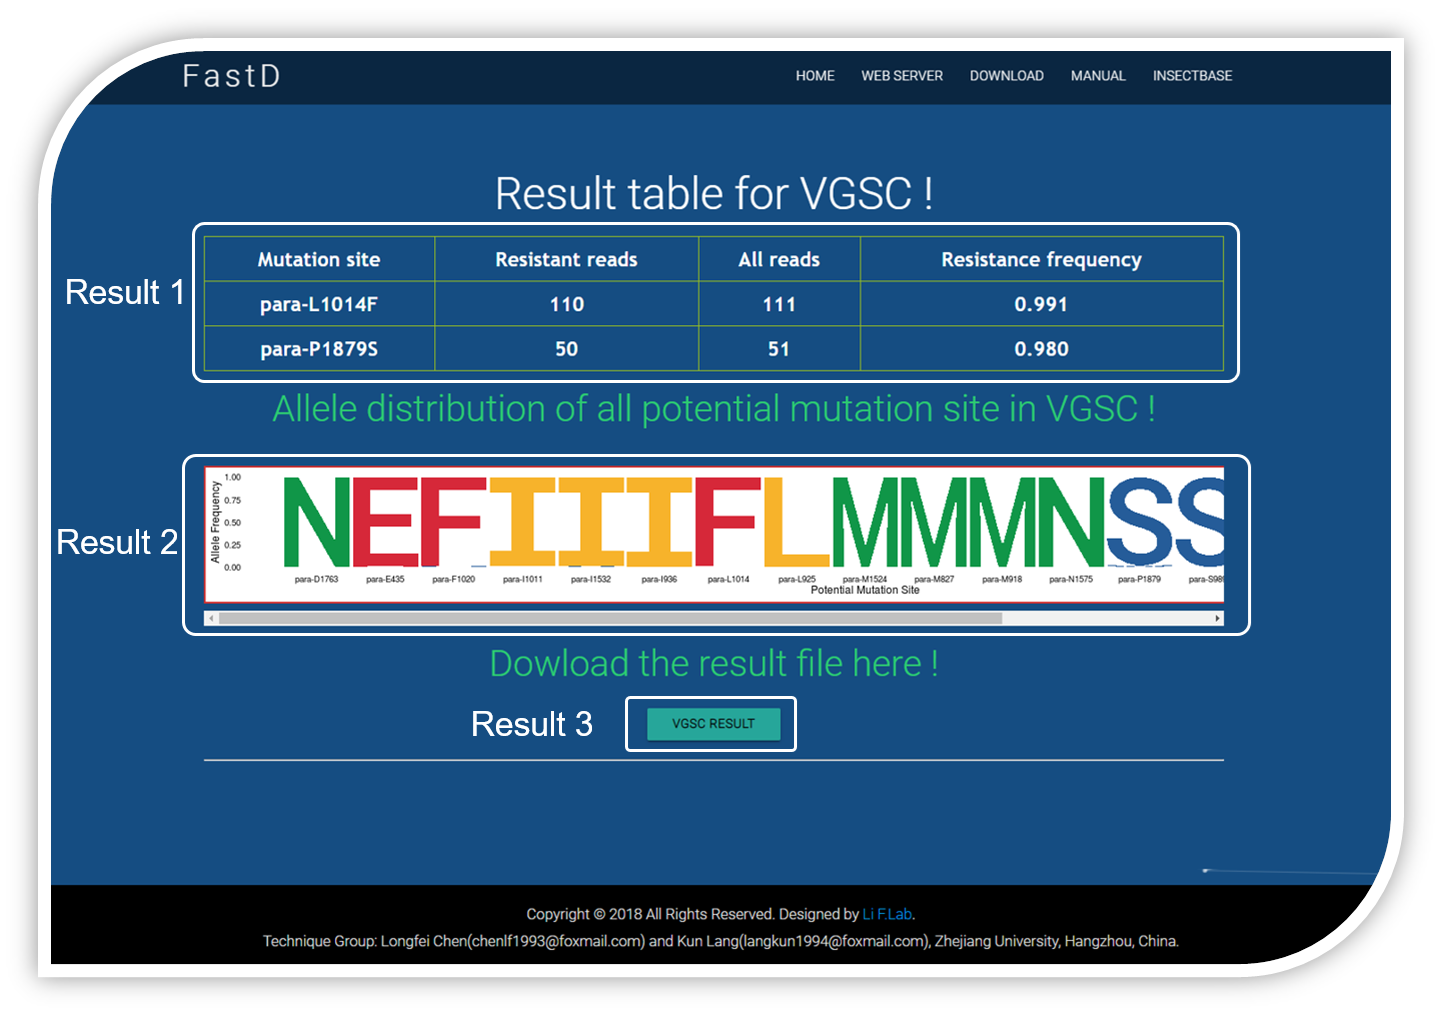
After few minutes’ processing, the output of your test samples are displayed on the result page include detected mutation table, mutation plot and details of codon distribution.
Result 1 : the mutation table provide a list of amino acid substitutions detected among the potential mutation sites, and the mutation frequency are also calculated.
Result 2 : the result figure display amino acid substitutions and their frequencies in all potential mutation sites. Each column represents one potential mutation site, the letter(s) which differs from the last letter of the tick are considered as mutations, the heights of the letters represent the frequencies of the mutations in test population. For example, VGSC result in the picture shows that amino acid substitution from Leu to Phe occured in position 1014 in para gene with mutation frequency 99.1% which means more than 99.1% of individuals in the test population have gotten L1014F mutation and acquired resistance to pyrethroids insecticides.
Result 3 : you can click the button to download the .csv file containing RESULT 1.
FastD_MR webserver
FastD_MR was developed to detect the insecticide resistance–associated detoxification genes from RNA-Seq data. The overepression of detoxification enzymes have always caused cross resistance to many classes of insecticides. Detection of overexpressed detoxification genes which associated with resistance is very essential for insecticide resistance management. FastD_MR mainly conducted differential gene expression analysis for all detoxification genes between sensitive and resistant samples using RNA-Seq data. In total, we collected 12665 detoxification genes from 82 species.
Preparation of input
Due to the large memory of RNA-Seq raw data, we choose the alignment files which generated by aligning reads in RNA-Seq data to all detoxification genes of test species as the inputs. To prepare the alignment files of test species, all detoxification gene sequences of the species should be downloaded first. Then, the RNA-Seq data of test samples were aligned to all detoxification genes using Bowtie2 with an important parameter –no-unal which can minimize the memory of alignment files. The outputs of bowtie2 alignment would be the inputs of webserver FastD_MR.
Upload the input
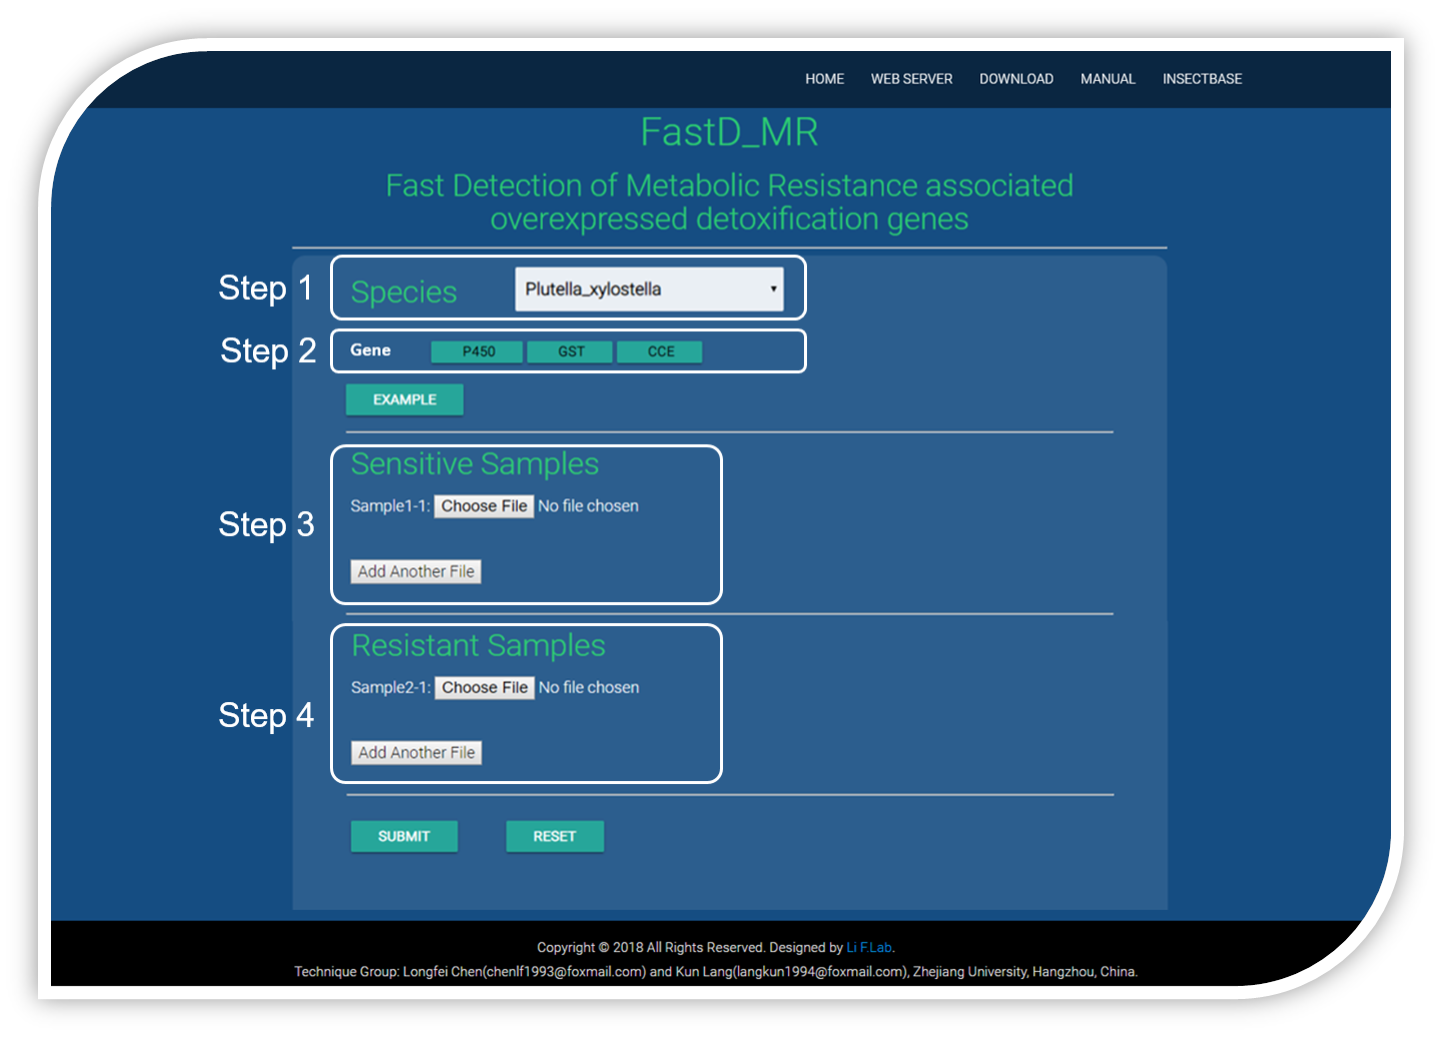
Step 1 : select the tested species from the species list.
Step 2 : after the species be selected, the detoxification gene families of this species would displayed, then tick your test gene families.
Step 3 : upload the alignment sam files of sensitive samples one by one.
STEP 4 : upload the alignment sam files of resistant samples one by one.
Click the submit button and wait a few minutes.
EXAMPLE file can be downloaded by click the "EXAMPLE" button, the species of the examplary files are Plutella xylostella.
FastD_MR Result
After few minutes’ processing, the output of your test samples are displayed on the result page.
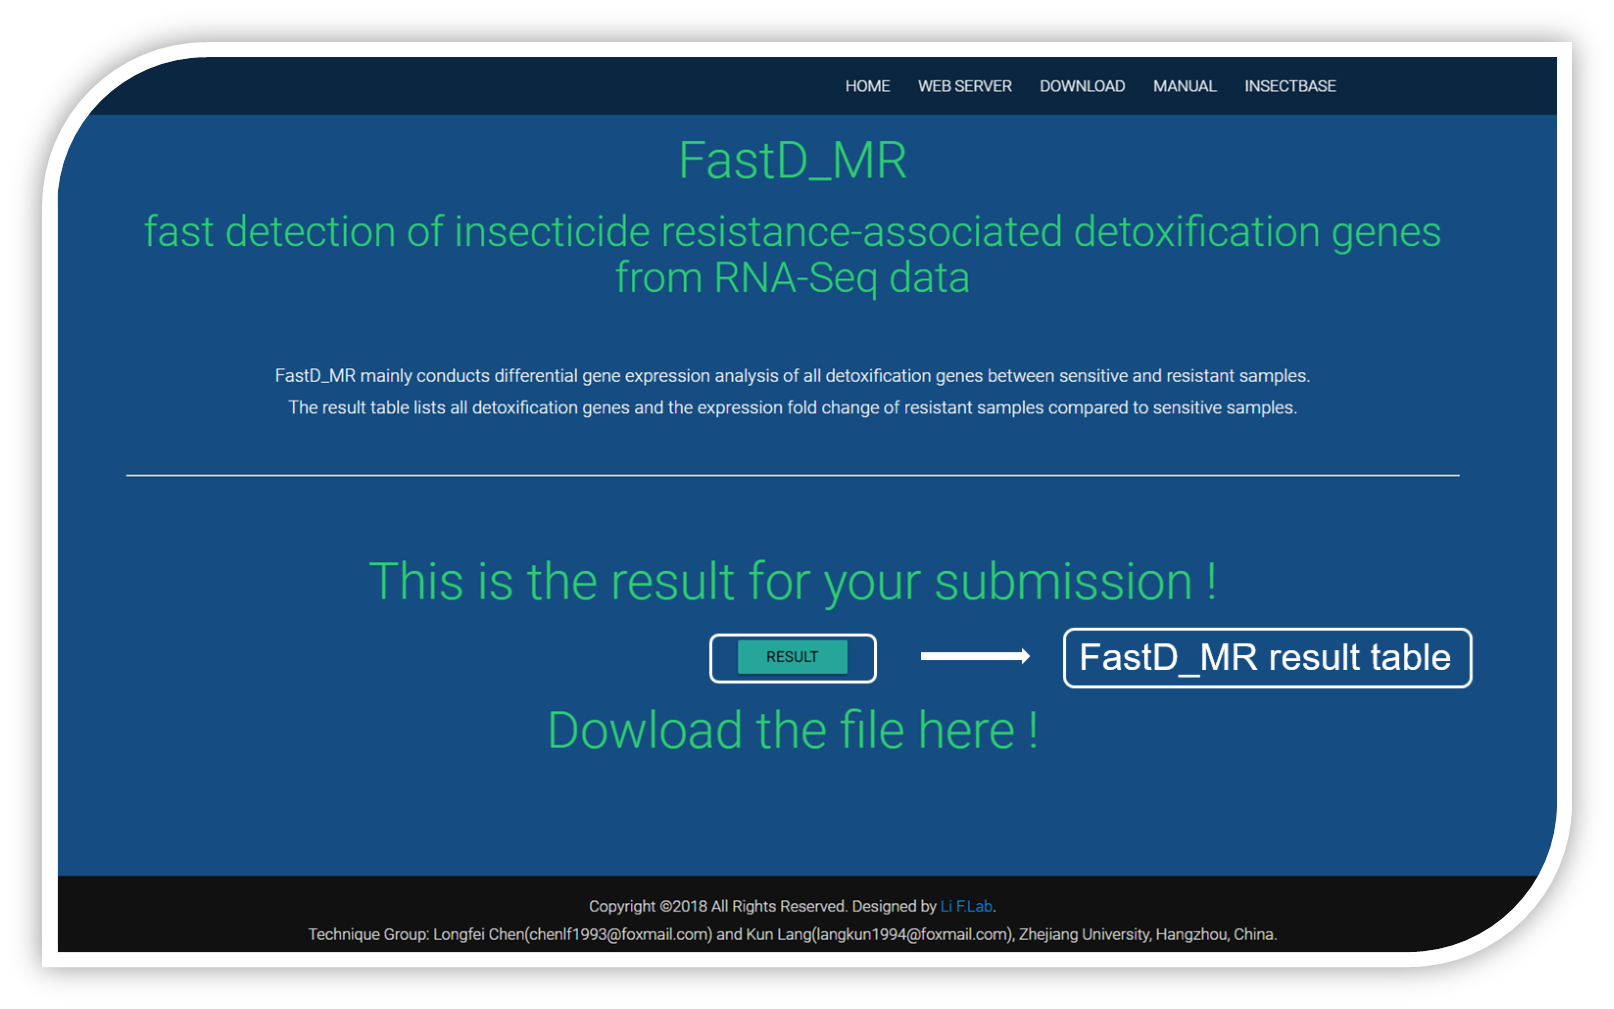
The differential expressed gene list
The result table lists the expression fold change of each differential expressed detoxification gene of all samples, and the test p value between resistant samples and sensitive samples.
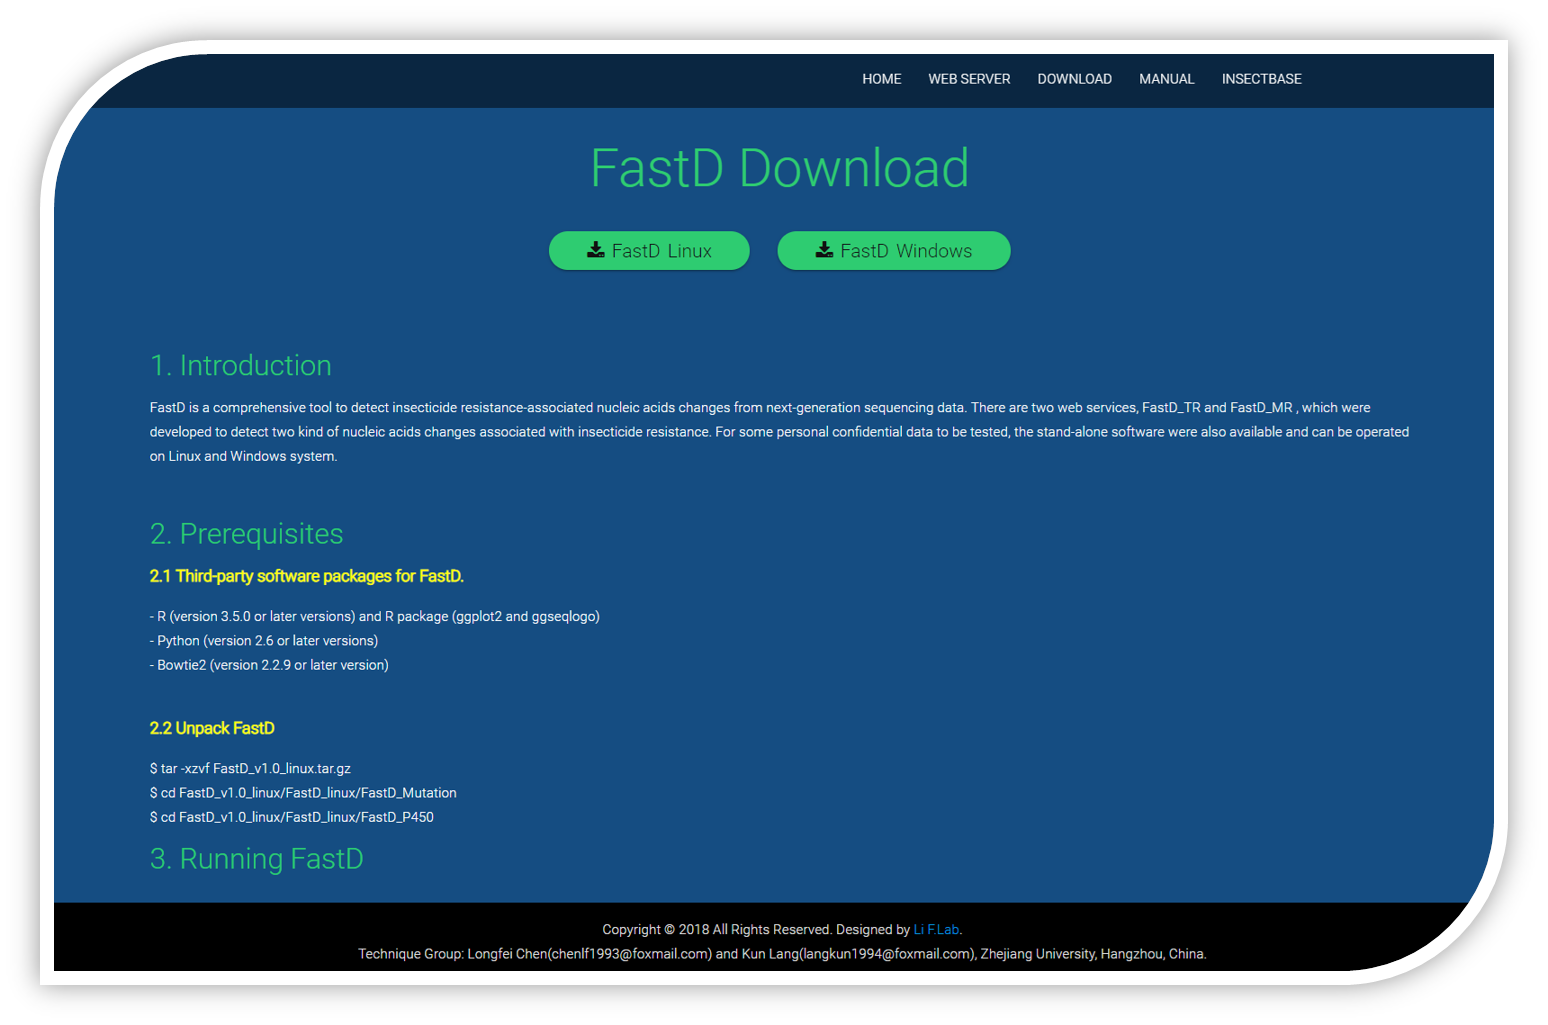
Download Data
In download page, you can download the stand-alone software and the sequence data.
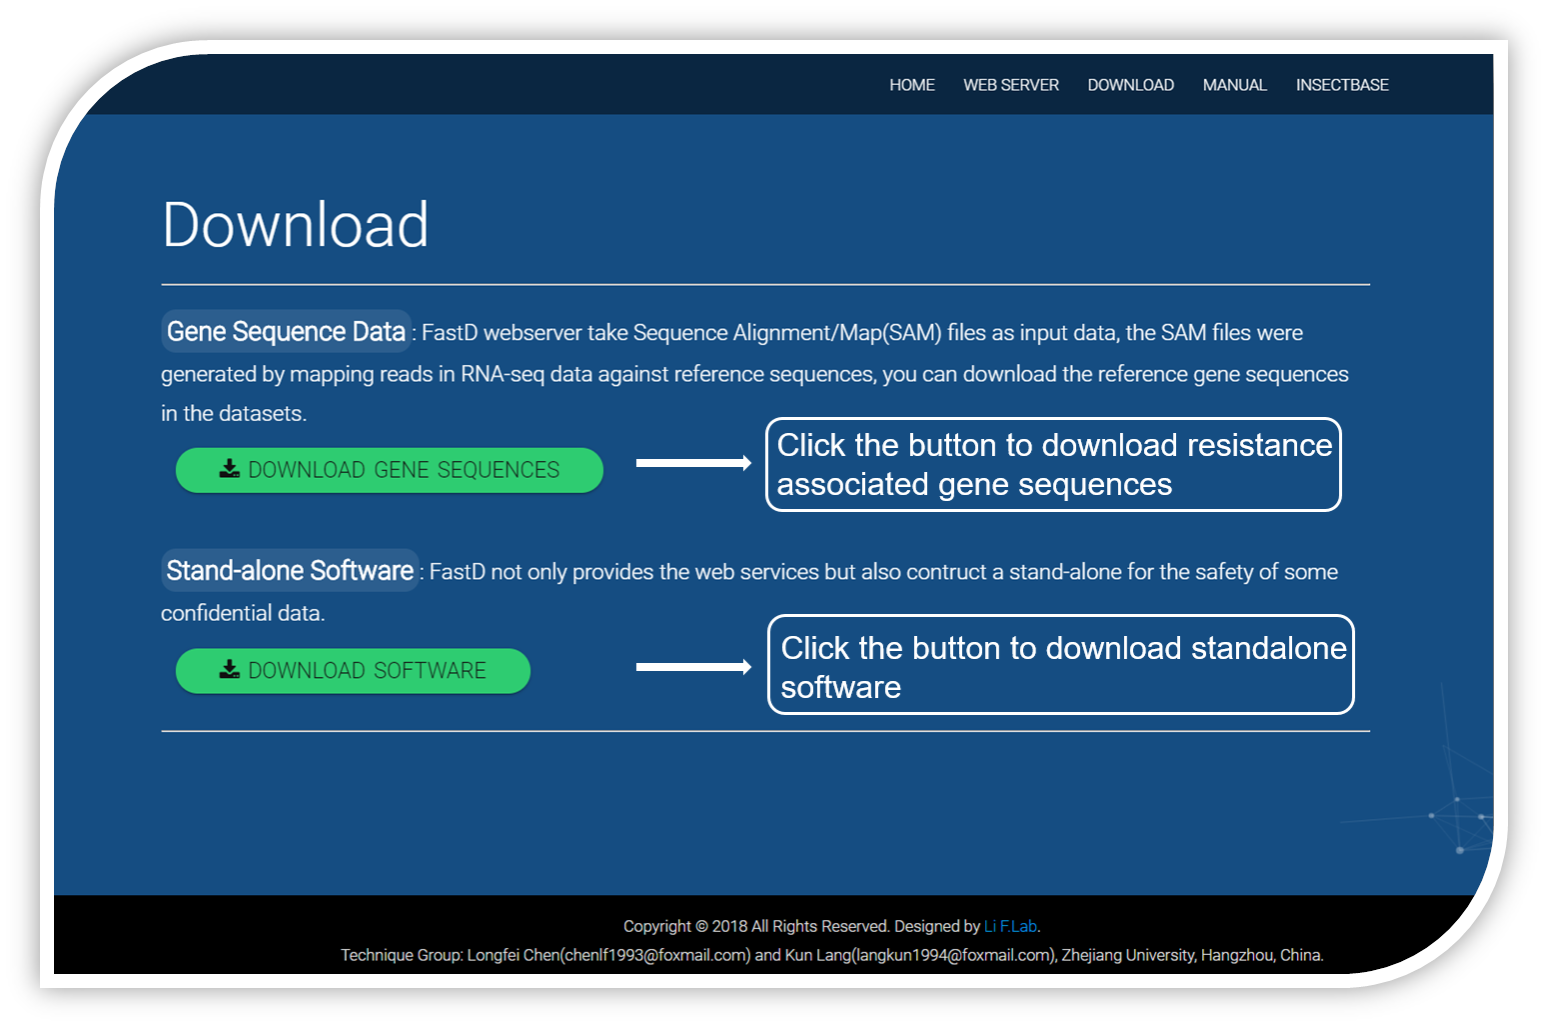
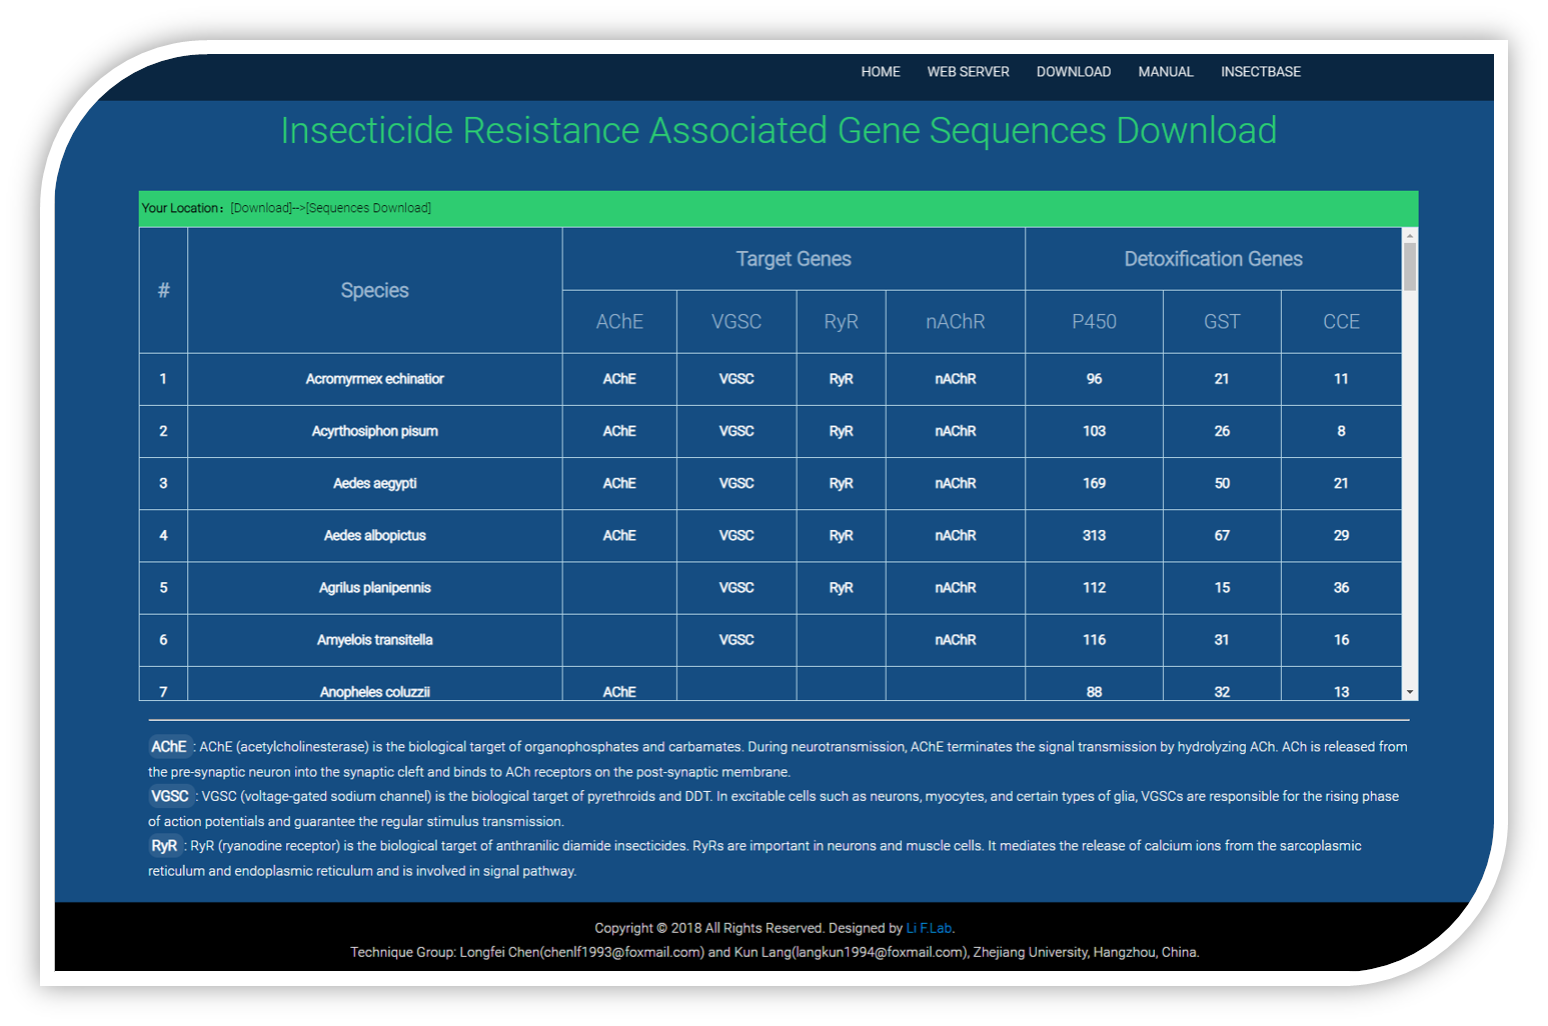
Sequence data download
To detect the genotypes associated with insecticide resistance, the preparation of inputs and the FastD processing were all based on alignment. To ensure the properly operation, the reference in preparation and the operation should be the same. The common sequences can be downloaded in the data download page.
Stand-alone software download
We also provide the stand-alone software for users. The stand-alone software can be operated on both Windows and Linux systems.